Introduction
This is the 3rd series of white paper that provides a brief and data specific assessment of the current networks with respect to the customer experiences while using the 3G & 4G mobile network in the twin city. Drive test provides an actual real world capture of the RF environment under a particular set of network and environmental conditions. Apart from this, our 3rd QoS audit is also important as most operators have recently gone through Biometric SIM Verification process as per the National Action Plan (NAP); which actually resulted in the decreasing the number of subscribers of each operator which led to giving opportunity to the operators to improve their services in order to gain their lost subscribers base. Hence this white paper compares improvements/degradations of each operator’s network and their services for the end users.
|
Mobile subscribers expect that mobile networks will provide good voice and data quality and due to these expectations any kind of interruption in mobile services is critical to the user’s experience about particular network. For the above described reason periodic benchmarking or audit of the QoS evaluation is vital to evaluate operators performance so that they can work on the improvement in order to secure a competitive edge in the market. The QoS standards are setup to make sure that the costumers are provided satisfactory level of services and ensure that operators meet minimum acceptable standards of service.
Subscribers of the mobile operators want their mobile services to work round the clock, everywhere and with good speed which means that network performance in terms of both voice and data is pertinent in contemporary connected world. The results achieved through drive test can be proved helpful for the configuration and the maintenance of mobile networks as it provides a demo of the network performance and also highlights pros and cons of a specific network operator.
3G/4G Data Benchmarking
With our results and feedback from the user end perspective, the networks irrespective of the operator can improve further where required. The mobile network operators have to ensure quality service for which regular performance survey and measurement of quality parameters of their networks is conducted on regular basis.
1.1 Purpose of Benchmarking:
The main objective of network audit is to get an impression of how the network is performing with respect to network service KPI’s. This enables network operators to improve network quality and maintain a balance between capacity, coverage and quality. Network QoS parameters are universally accepted Key Performance Indicators (KPI) that serve as the guiding principles for professionals to analyse and keep network services within specified threshold for the desired QoS criteria.
Previously, two QoS audits were carried out to study and compare the network performance of different mobile operators. This is the 3rd QoS audit keeping the Key Performance Indicators (KPI’s) in mind which have been mandated by Pakistan Telecommunication Authority (PTA).
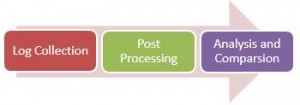
The QoS benchmarking was performed using standard network audit tools and commercial devices in three Phases.
1.2 Test Implementation:
The project was initiated in the 2nd week of September 2015. Drive testing was conducted in the first phase of the project while post processing and analysis (2nd and 3rd phase) were done in the 3rd and 4th week of September. For 3G networks, drive tests were performed for two operators simultaneously. Data collection was done for Mobilink and Ufone in the afternoon and then the same route was taken for Zong and Telenor in the exact same hours the other day. For LTE networks, data collections were also done in the around 1:00 pm in the afternoon. All the tests were conducted in mobility and main locations of Islamabad and Rawalpindi were covered as these area have good coverage of all the networks.
It should be noted that the network assessment in others cities can be different. The main goal of the route and city selection was to make a more objective and technically accepted assessment to educate interested professionals, regulator, vendors and consumers about the current operational state of the 3G and 4G networks in Islamabad. The figure shows the drive route on which tests were conducted.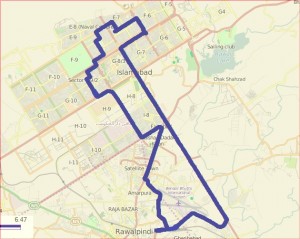
2.QoS Procedure, Technology & KPI’s
2.1 QoS Procedure
Our audit is based upon quality of data related services only, the following settings/comment for interpretation of results;
- Samsung Galaxy S4 i9515 of CAT 14 3G and Cat-4 LTE were selected for testing.
- The devices were locked in the specified network mode preference.
- The tests were performed in mobility over a specific route.
- Our findings and conclusions may not be 100% consistent to the consumer experience.
2.2 QoS Key Performance Indicators
To analyse the QoS, the focus was on the following KPIs while collecting the logs over the drive route. These KPIs are specifically for Data throughputs.
2.2.1 3G Data Throughputs
- Downlink Throughput
- Uplink Throughput
2.2.2 4G Data Throughputs
- Downlink Throughput
- Uplink Throughput
2.2.3 3G & 4G Channel Quality
- Channel Quality Indicator (CQI)
3. Quality of Service (QOS) Benchmark
It should be noted that the level of reporting of service quality may differ or will not be exactly similar to consumers’ experiences.
For details regarding 3G KPI’s please refer to our previous white paper “Pakistan’s first 3G Mobile Service benchmarking” on PHONE WORLD website. Since we have an entry of LTE services so it was of prime importance to shed light on some key parameters that assessed the data rates of downloads and uploads over the route.
LTE Service
*In cellular networks, when a mobile moves from cell to cell and performs cell selection/reselection and handover, it has to measure the signal strength/quality of the neighbour or adjacent cells. In LTE network, a User Equipment (UE) measures two parameters on reference signal:
RSSI – Received Signal Strength Indicator: The carrier’s RSSI (Receive Strength Signal Indicator) measures the average total received power observed only in OFDM symbols containing reference symbols for antenna port 0 (i.e., OFDM symbol 0 & 4 in a slot) in the measurement bandwidth over N resource blocks.
The total received power of the carrier’s RSSI includes the power from co-channel serving & non-serving cells, adjacent channel interference, thermal noise, etc. Total measured over 12-subcarriers including RS from Serving Cell, Traffic in the Serving Cell
RSRP – Reference Signal Received Power: RSRP is a RSSI type of measurement.
It is the power of the LTE Reference Signals spread over the full bandwidth and narrowband.
A minimum of -20 dB SINR (of the S-Synch channel) is needed to detect RSRP/RSRQ
RSRQ – Reference Signal Received Quality: Quality considering also RSSI and the number of used Resource Blocks (N) RSRQ = (N * RSRP) / RSSI measured over the same bandwidth. RSRQ is a C/I type of measurement and it indicates the quality of the received reference signal. The RSRQ measurement provides additional information when RSRP is not sufficient to make a reliable handover or cell reselection decision.
In the procedure of handover, the LTE specification provides the flexibility of using RSRP, RSRQ, or both.
It must to be measured over the same bandwidth:
- Narrowband N = 62 Sub Carriers (6 Resource Blocks)
- Wideband N = full bandwidth (up to 100 Resource Blocks / 20 MHz)
3.1 3G Data Performance
3.1.1 Downlink Throughput for 3G
For the analysis of the data download performance large files were downloaded via mobile internet connection. FTP server was used to download the files. The rate at which the files were downloaded were recorded using different tools, the download throughput varied according to the changes in factors like RSCP, CQI, Ec/Io for 3G while RSRP, CQI and Ec/Io were used to determine 4G.
3.1.1.1 Mobilink
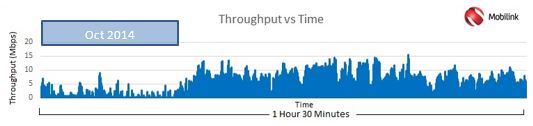
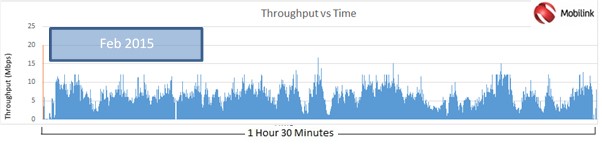
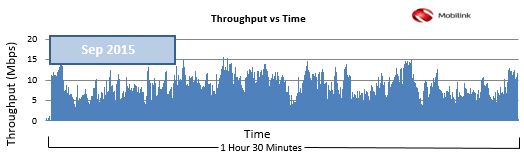
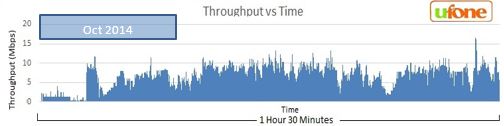
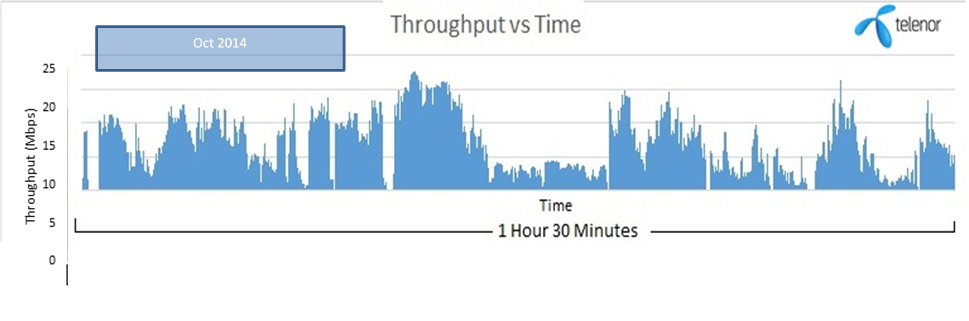
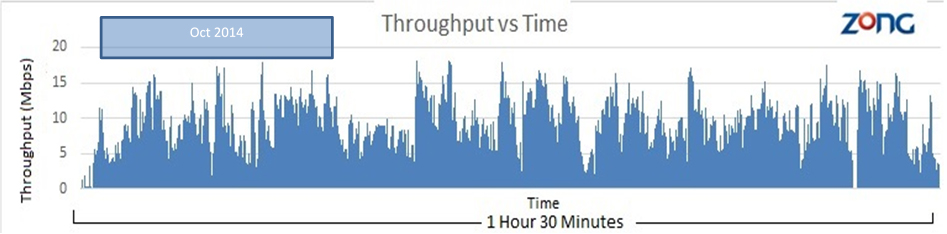
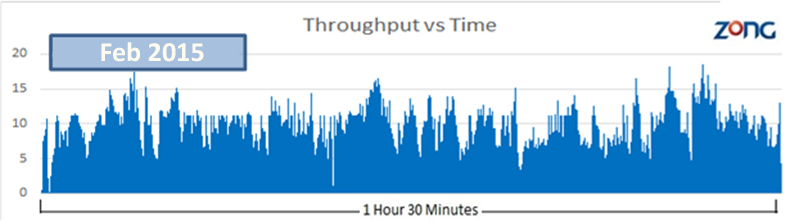
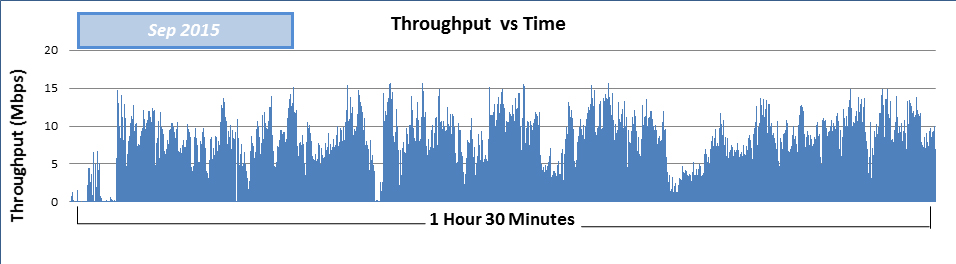
To get an idea on how the throughput varies across the drive route few detailed graphs have been constructed to better understand the behaviour of the obtained throughput. The graphs above shows the throughput attained by Mobilink network during each test.
|
The first graph shows the throughput obtained on Oct 2014, the second graph shows the throughput obtained during the month of Feb 2015 while the third graph displays the throughput of each sample during the month of Sep 2015. It should be noted that during the first data benchmarking no data bundle was activated because Mobilink offered free trail to its users. The maximum throughput value achieved during recent benchmarking was 15.5 Mbps (16.6 Mbps in Feb’15 & 16.6 Mbps in Oct’14) while the average throughput obtained was 3 Mbps (2 Mbps in Feb’15 & 3 Mbps in Oct’14).
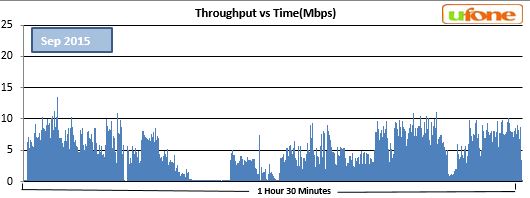
3.1.1.2 Ufone
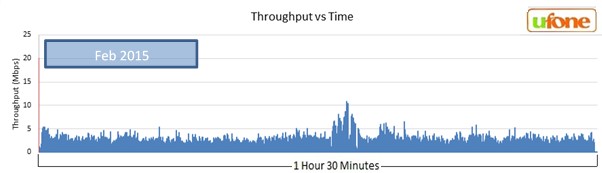
The maximum throughput achieved was 13.4 Mbps (15.1 Mbps in Feb’15 and 16.9Mbps in Oct’14) and average values achieved was 1.2Mbps (2.1 Mbps in Feb’15 and 6Mbps @ Oct’14).
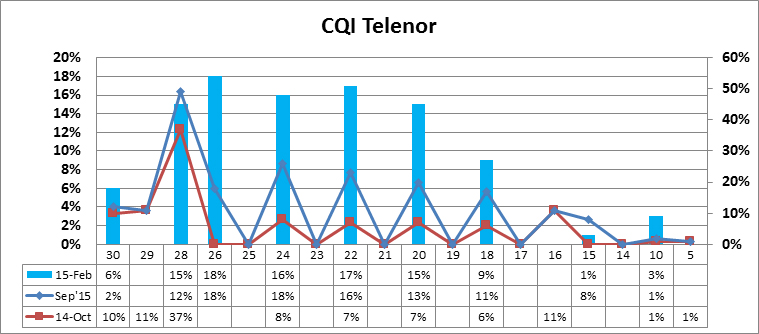
3.1.1.3 Telenor

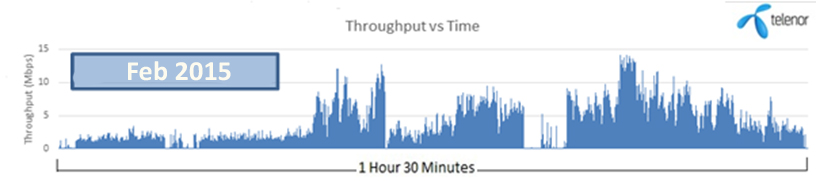
The rise and fall of the graph indicates the communication between UE and Node-B, and the assigning of the respective CQI to avoid disconnection and continuous throughputs.
Ufone and Telenor’s throughput results revealed downward trend with maximum throughput of 13.4 Mbps and 10.39Mbps respectively
The maximum throughput achieved by Telenor was 10.39Mbps (14.1 Mbps in Feb’15 and 18 Mbps in Oct’14) while the average value achieved was 1 Mbps (4 Mbps in Feb’15 and 5 Mbps in Oct’15). It can be seen from the graph that some of values achieved for throughput are low because of low RSCP which resulted in low CQI.
3.1.1.4 Zong
Zong on the other hand showed some consistent behaviour. The maximum peak achieved was 15.7 Mbps (18.5 Mbps in Feb’15 and 21 Mbps in Oct’14). The average throughput achieved was 4 Mbps (5.2 Mbps in Feb’15 and 6 Mbps in Oct’14).
3.1.2 Average 3G DL Throughput Comparison
The graph shows a summarized comparison of the performance of each operators during three benchmarking test.
It was observed that while for all operators the throughput was of downward trend but the decrease has been nominal for Zong and Mobilink that took the lead in achieving higher average downlink throughput of 4 & 3 Mbps respectively. While, Zong’s throughput decreased as compared to last QoS audit but the most significant degradation was witnessed in Telenor and Ufone’s throughput results.
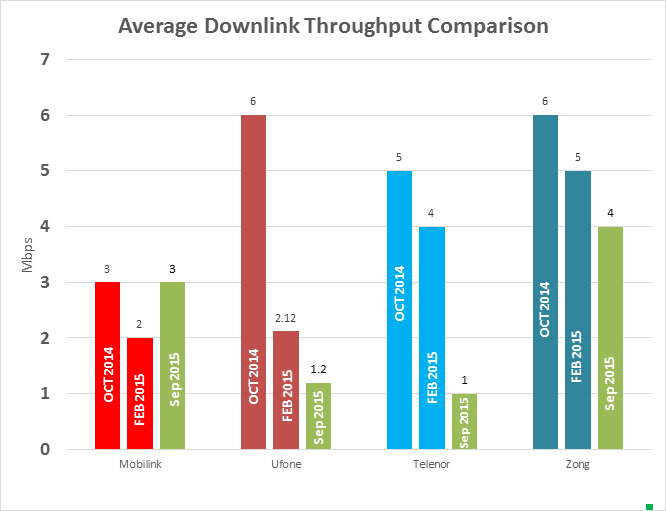
Telenor showed a drastic decrease and achieved around 1 Mbps from its previous value of 4 Mbps. Whereas, the throughputs for Ufone also tapered and degraded from 6 Mbps to 2.12 Mbps and finally in recent test it reached 1 Mbps.
3.1.3 Average 3G Uplink Throughput Comparison
For the calculation of uplink throughput, specific files were uploaded on the server and its uplink rate was measured. Since, it was in mobility, the CQI, RSCP and RSSI changed from location to location due to change in noise levels and possibly other available traffic at that time. So it had to force the Node-B and the UE to communicate and select the best possible modulation to provide best achievable throughputs. It is the inherit property of the network to schedule data rates among the users judicially.
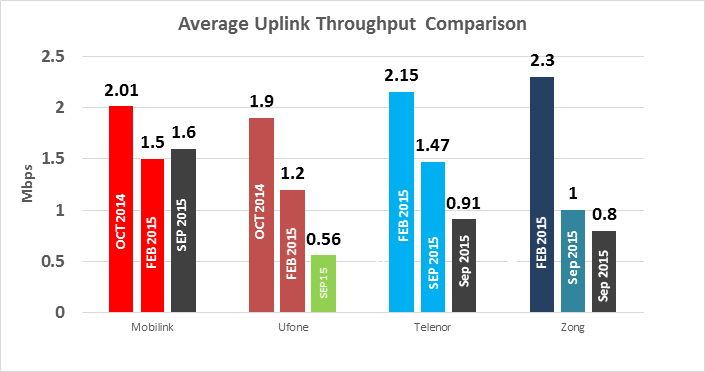
For uplink throughput evaluation large file were uploaded to the FTP server from UE throughout drive route. The graph compares the average upload throughputs that were achieved during the drive test.
|
From the graph it can be observed that while uplink throughput for all operators decreased, Mobilink took the lead in upload throughputs and achieved average throughput of 1.6 Mbps, while Telenor came 2nd with throughput value of 0.91 Mbps. Zong witnessed a decrease in throughput from 1 Mbps to 0.8 Mbps. Ufone on the other hand achieved an average throughput of 0.56 Mbps.
3.1.4 CQI Value Comparison for 3G
Channel Quality Indicator (CQI) is the value calculated collectively by the User Equipment and Node-B indicating how fast or slow the UE can communicate with the network.
In downlink and uplink, the CQI values ranges from 0 to 30, where 30 indicates the best quality channel and 0 to 1 indicates the worst quality channel. This parameter is used mainly for data services.
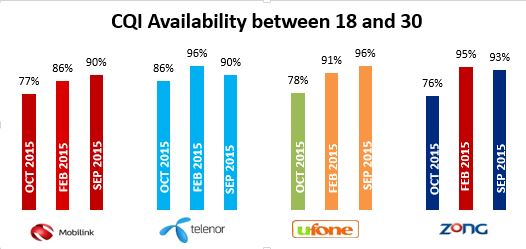
The above figure indicates the availability of good CQI of the entire route for each operator. The good CQI ranges from 18 to 30. The graph clearly indicates that the coverage has improved for each operator. For detailed distribution we have added break down of the CQI values for each operator. We have placed the graphs in pairs since we performed the drive test over two operators at the same time with combination of Zong, Mobilink and Ufone, Telenor. For the first run we used Zong and Mobilink so we placed them together here as well.
First RUN: Drive Testing Mobilink and Zong
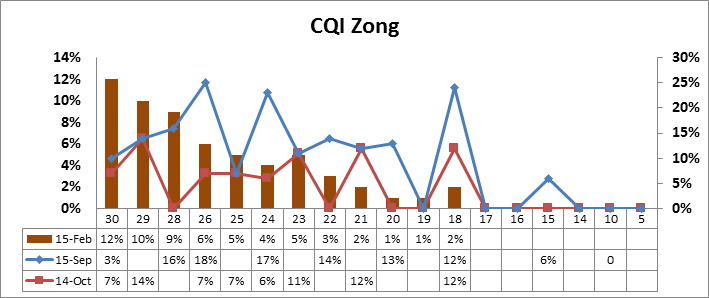
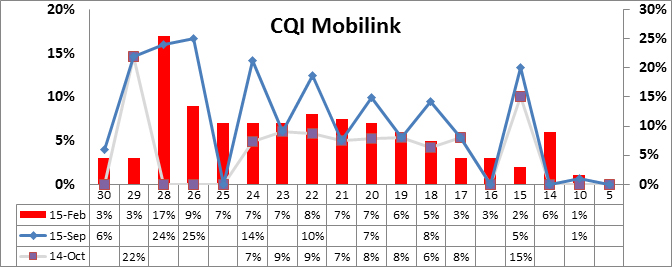
This is the detailed view of CQI over the entire drive route. The blue line indicates the level of CQI achieved in September 15. It can be observed that overall for each operator average CQI lies in good region which is clearly supporting the good downloads for Zong as its Lower CQI has very low contribution to the network. Similarly for Mobilink the CQI distribution is almost the same but comparatively have less contribution from good CQI values.
Second Run: Drive Testing Telenor and Ufone
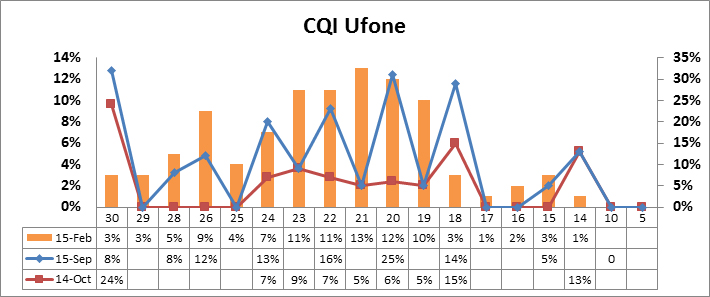
Ufone has shown major improvement in terms of CQI in comparison with last two tests. While Telenor graph is almost same as its last performance which indicates that Telenor has not improved its coverage.
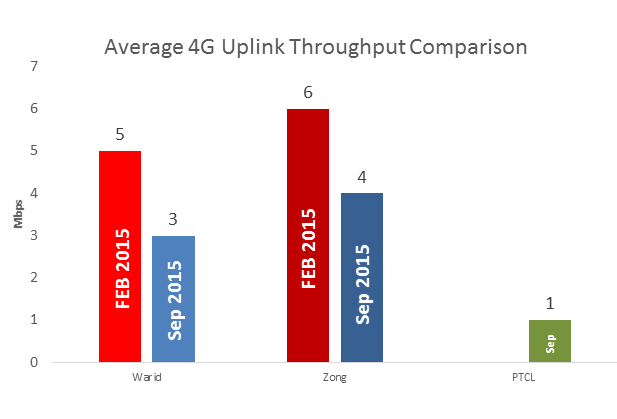
3.3 Average Throughput Comparison for 4G
4G data throughputs were performed on the same route. The summarized Upload and Download throughputs are shown in the graph.
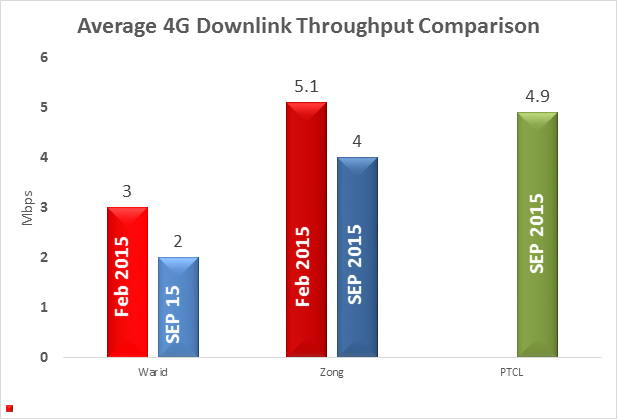
The values are less than 10 Mbps for both uploads and downloads. This can be due to number of active users in that sector.
The acceptable throughputs with a loaded network during peak hours should be around 4Mbps<UL<7Mbps and 8Mbps<DL<9Mbps. So it is quite evident that uploads fall within the range but downloads do not. So it may be due to the shared resources.
|
By looking at the downlink throughput graphs, it can be clearly seen that PTCL leads in downlink throughput. During recent drive test of Sep 2015, PTCL achieved an average throughput of 4.9 Mbps, Zong attained an average throughput of 4 Mbps whereas Warid reached an average throughput of 2 Mbps.
Similarly for the uplink throughput, Zong has shown good values of uplink as compared to Warid and PTCL. The average throughput for Warid and Zong have dropped. Warid has achieved 3 Mbps for Uplink, Zong achieved 4 Mbps while PTCL achieved the lowest uplink throughput of 1Mbps.
Although drop in Warid and Zong’s 4G uplink and downlink throughputs were witnessed but Zong successfully maintained its upper hand by putting together better values in both tests
Our experience of using the LTE was good, large files of around 200MB were processed more than twice during the testing. Considering the fact that these networks are still getting optimized for better performances; such values are acceptable form a common user’s end. Another thing that should be taken into consideration is that the above readings are summarized from mobility. So it should not be compared to stationary values as those values are much higher in comparison to the mobility.
Other factors adding to the lower data rates are the number of hops from server to server and the resources available for the files to get transferred. For Example while using HTTP transfers, the site used for transfers may have issues or may have too many users to support at the same time. So the site schedulers reduced the resources for each user to keep a common rate for each one of them. In short it is stated as the shared rate. Though we did not face such issues during mobility at Red Signals and short breaks, increase in Uploads and Downloads was seen which means that the rates increased during stationary.
Secondly we cannot ignore the fact that PTCL, Warid and Zong have a good customer base in Islamabad. The transferring data may be due to OTA updates, emails, web-surfing, streaming, active navigation etc. and most importantly internet hotspots. So both the operators, have to allocate the resources to enable equivalent rates for each user. In this case the network assigns rates in a way that people near or away from the Node have acceptable rates in that particular sector. So at this stage the RSRP, RSCQ and RSSI and the UE communication begins to decide the best Resource Block for that particular customer.
4. Conclusion
The purpose of this benchmarking was to compare the four 3G and three LTE operators in Pakistan. This benchmarking reports the comparison of five operators by using standard KPIs for the most popular services like data download and upload.
|
After completing this third benchmarking, we were able to have an overview of the improvements made by the five operators and also the locations where parameters can be further enhanced. The trends in the graph effectively depict that the results are somewhat similar to our last QoS with only minor changes in uploads and downloads. Mobilink stands at the same position i.e. second best and Zong is the best among all operators. For overall 4G LTE audit PTCL’s performance was the best whereas, if we compare mobile operators alone, Zong took the lead again and achieved higher throughput in both Uplink and Downlink as compared to its competitor, Warid, the other 4G/LTE operator.
Due to the increasing number of 3G/4G subscribers; the focus of the network operators has shifted towards coverage and maintenance than the data rate. The improved network by five operators has led many subscribers to join the advanced 3G and 4G services which ultimately increased the overall subscriber base. Even now the networks are still going through optimization and it will keep on improving further. The 3G and 4G networks are still improving along with a focus on coverage area. Also the auction of left over spectrum of 4G will contribute towards connected Pakistan.
The significance of QoS survey can never be taken for granted as it is the only impartial and transparent way to identify operator’s services. It is beneficial for both operators and the end users to become aware about the performance of their respective network. So the objective is to keep a healthy environment between users and operators. Additionally Regulator plays a vital role to voice customers’ confusion and complaints to ensure that operators meet the set standards of services.
PTA Taxes Portal
Find PTA Taxes on All Phones on a Single Page using the PhoneWorld PTA Taxes Portal
Explore NowFollow us on Google News!